NOTE INVESTING MADE SIMPLE
Backed by 25+ years of industry insight, battle-tested strategies, and real-world successes as principle buyers, NoteTradeX gives you the tools to trade mortgage notes with confidence and ease. Sign up now to connect directly with our network of trusted buyers and sellers. This is your gateway to smarter, faster, and more secure note trading.
NOTE TRADING RESOURCES
Seller Registration

Buyer Registration

Loan Servicing Options

Title Services & Reports

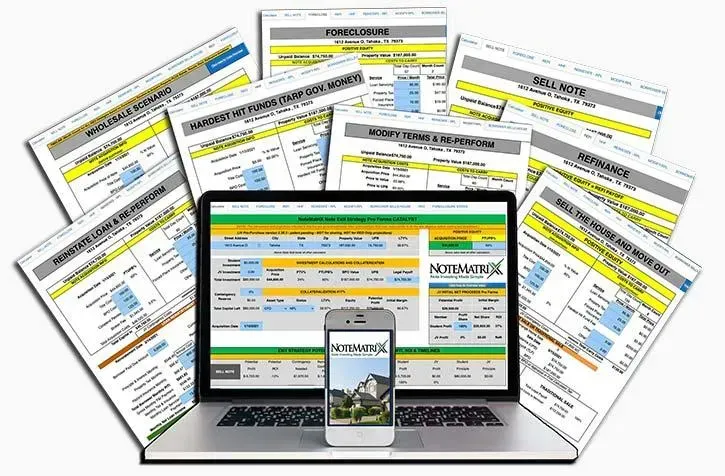
NoteMatriX Training
Data & Analytic Reports
Core Logic Insights

BPO's & Appraisals

NoteTradeX isn’t just in the game—we’re setting the pace. With 2,000+ active clients and hundreds of millions in loan volume, we dominate the mortgage note trading space coast to coast. Fast deals? That’s our standard. Whether it’s one loan or a multi-million dollar portfolio, we deliver razor-sharp execution from bid to close—no fluff, just results..
"TANGIBLE RESULTS, THROUGH KNOWLEDGE"